
A report from Accentureclearly highlights those companies that don’t want to capitalize on AI will not survive the future (see Figure 1). Adopt or die. Yippee Ki Yay, Mr. Falcon.
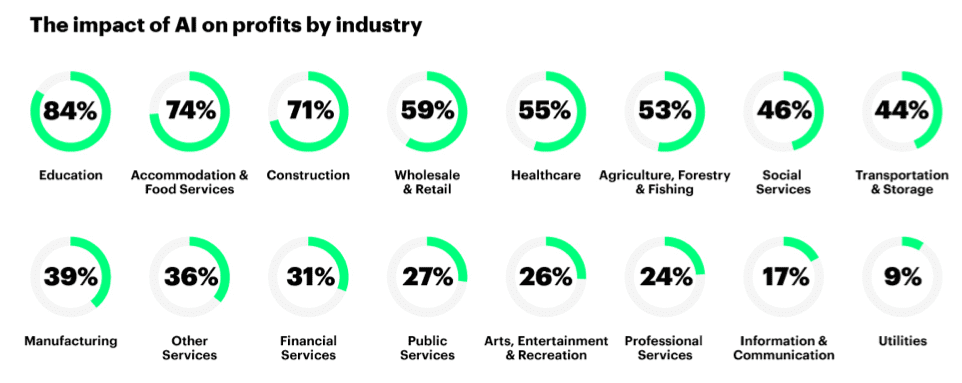
Figure 1: The Profit Impact of AI by Industry
The AI war is being fought with open source technologies such as TensorFlow, Spark ML, Caffe, Torch and Theano. But wait…if these AI algorithms and technologies – the “Weapons of Mass Business Model Destruction” – are readily available to everyone, what are the sources of business value and differentiation?
Increasingly the equation for deriving and driving business value and differentiation isn’t having the Machine Learning, Deep Learning and AI frameworks, but is found in two foundational principles:
- Identifying, validating, valuing and prioritizing the Use Casesfor which AI will deliver material business and operational value. Stephen Covey’s “Begin with an End In Mind” was never more appropriate, as organizations must invest in the upfront work to ensure that they thoroughly understand the problems they’re trying to solve, quantify the sources of business value, understand the metrics and KPI’s against which they’re going to measure progress and success, and understand potential implementation impediments and risks associated with False Positives and False Negatives.
- Ensuring organizations have identified and assessed the Data Sourcesneeded to enable the analytics that address the use cases.This requires a thorough assessment of the quality, accuracy, completeness, granularity, and latency of the data from which to mine the customer, product and operational insights that drive business value.
I have already written the book “Big Data MBA: Driving Business Strategies with Data Science” and several blogs on the “Thinking Like A Data Scientist” methodology which provides a thorough, business-driven process for identifying, validating, valuing and prioritizing the organization’s business and operational use cases. See the following blogs for more details on the “Thinking Like A Data Scientist” methodology:
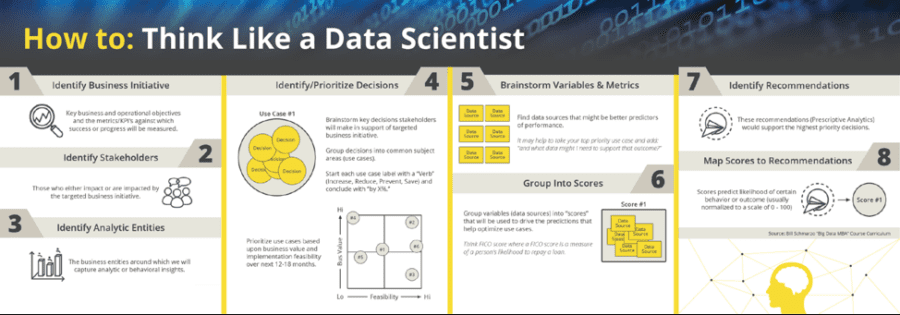
Figure 2: Thinking Like A Data Scientist Methodology
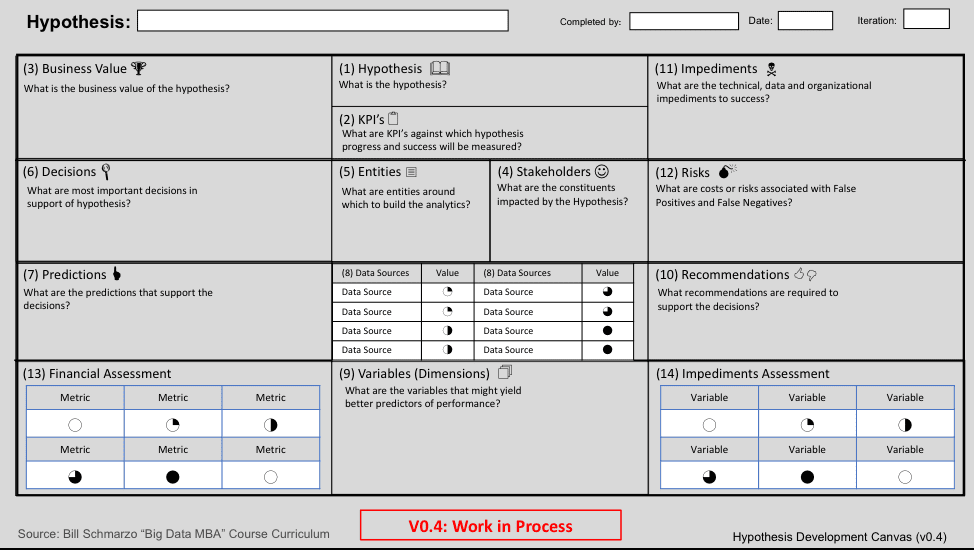
Figure 3: Business Hypothesis Development Canvas
Now let’s consider the other part of the AI equation – monetizing the data. As was well stated in the Sloan Review article “The Machine Learning Race Is Really a Data Race”:
“Data is becoming a differentiator because many companies don’t have the data they need. Although companies have measured themselves in systematic ways using generally accepted accounting principles for decades, this measurement has long been focused on physical and financial assets — things and money.”
Data Valuation Matrices
Throughout the data warehouse years, we struggled to get the business stakeholders to invest in their data. Anyone who has ever tried to sell your business stakeholders on a data governance program knows that data is the Rodney Dangerfield of corporate assets – it doesn’t get any respect!
In order to help organizations understand the importance of data governance and data management initiatives, we developed two data assessment matrices that are instrumental in helping organizations envision where and how data science can enable their key business initiatives.
The first of two, the Data Business Value Assessment Matrix, determines the relative value of each data source in enabling the analytics necessary for the business use cases (see Figure 4).
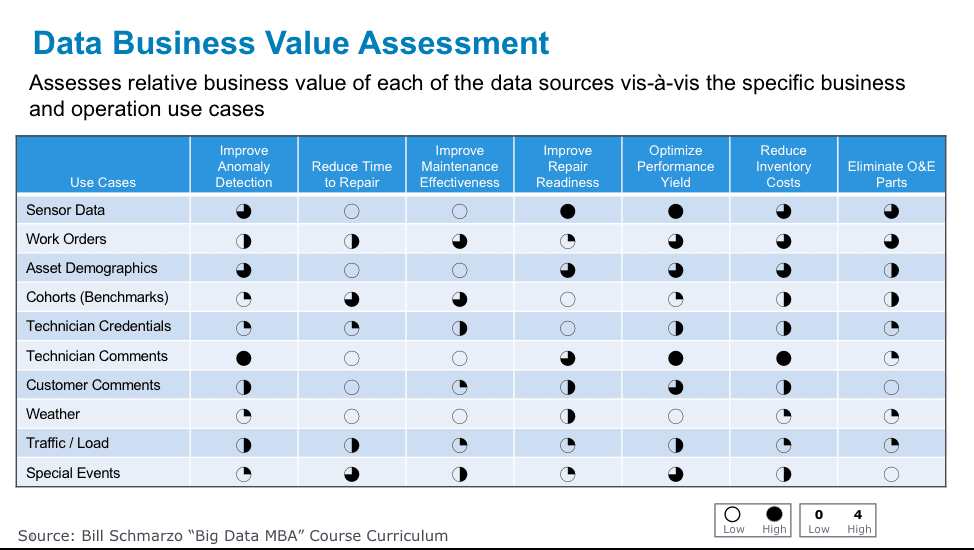
Figure 4: Data Business Value Assessment Matrix
The Data Business Value Assessment Matrix reframes the data valuation conversation by first brainstorming the data sources that the use cases might need. We then determine the importance of each data source vis-à-vis each use case through data science.
The Data Business Value Assessment Matrix probably looks familiar to folks who have read my University of San Francisco School of Management “Economic Value of Data” research paper. This technique was instrumental in helping attribute financial value to the data sources based upon their contribution to the analytics that support the use cases (see Figure 5).
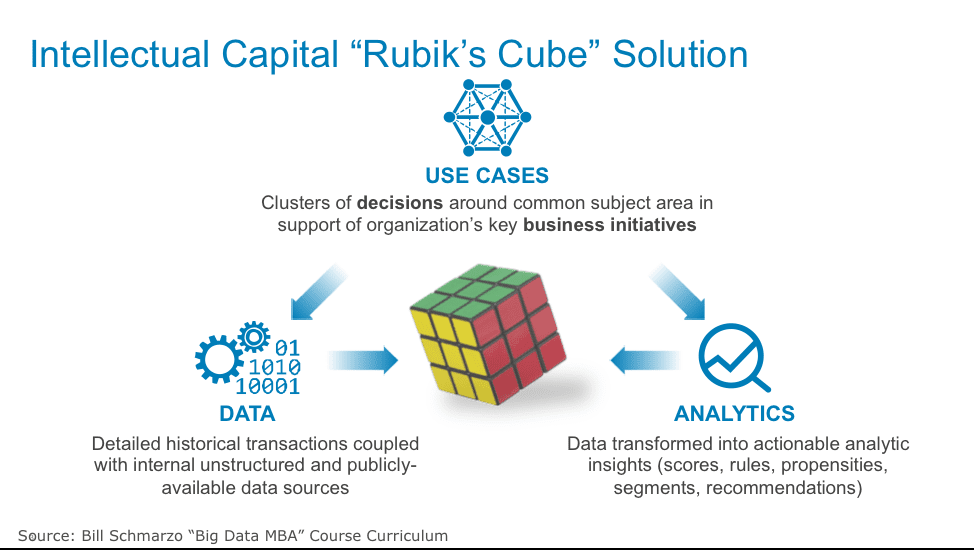
Figure 5: Importance of Use Cases in Framing the Economic Value of Data Determination
The second of the two, the Data Feasibility Assessment Matrix, assesses the technical feasibility and readiness of each of the data sources vis-à-vis key data management variables (see Figure 6).
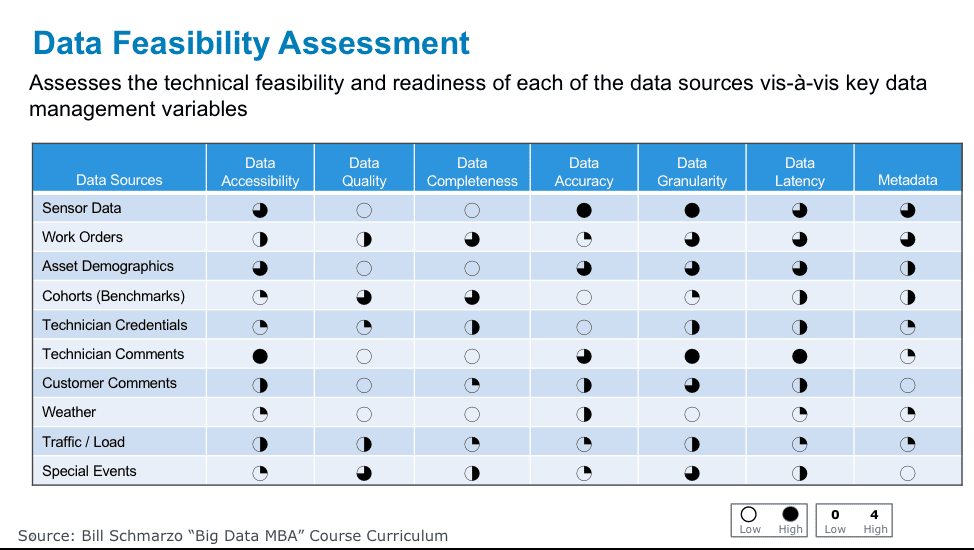
Figure 6: Data Feasibility Assessment matrix
Now that we 1) know which data sources are most important to our use cases and 2) have a general assessment of the technical feasibility of those data sources, we want to look at using techniques that make them even more valuable. And that brings us to the data discipline of Feature Engineering.
Understanding Feature Engineering
The quality of our data science and the resulting AI, Deep Learning and Machine Learning models are highly dependent upon the quality and richness of our data. And while there is much learning from our data warehouse and ETL experiences in trying to improve data quality, the field of enriching the data through feature engineering is still developing. Feature engineering is the process of using domain knowledge to engineer new data variables out of existing data variables in context of the business or operational situation that we are trying to address.
Types of Feature Engineering include:
- Data integration, whichis probably the most basic of Feature Engineering capabilities. It involves combining data residing in different sources using shared content (keys) into a unified view, based upon the subject being addressed.
- Normalization and Standardization, two termssometimes used interchangeably, but refer to different things. Normalization means to scale a variable to have values between 0 and 1, while standardization transforms data to have a mean of zero and a standard deviation of 1 (a z-score).
- Data Blending,a process where data from multiple sources are merged into a single data set in a non-permanent format to determine the predictive value of the blended metrics.
- Data enrichment,which merges third-party data with internal data sources to enhance the predictive capabilities of the data.
- Composite metrics,which define a new higher-level metric by specifying mathematical transformations and weightings to perform on a selection of native metrics. For example, a FICO Score is comprised of over 30 metrics that are weighted in a way as to yield the best predictor of an individual’s loan repayment capabilities.
From the book “Feature Engineering for Machine Learning: Principles and Techniques…”, written by Alice Zheng and Amanda Casari, we get the following Feature Engineering summary (by the way, I bought the book and will be reading it over the holidays…yep, that’s my definition of fun):
“Machine learning fits mathematical models to data in order to derive insights or make predictions. These models take features as input. A feature is a numeric representation of an aspect of raw data. Features sit between data and models in the machine learning pipeline. Feature engineering is the act of extracting features from raw data, and transforming them into formats suitable for the machine learning model. It is a crucial step in the machine learning pipeline, because the right features can ease the difficulty of modeling, and therefore enable the pipeline to output results of higher quality. Practitioners agree that the vast majority of time in building a machine learning pipeline is spent on feature engineering and data cleaning.”
Data Science and the Role of Feature Engineering
Data science is about identifying those variables and metrics that might be better predictors of performance.
Feature Engineering is a critical activity in the Data Science process by helping the Data Scientists to create new variables that might be better predictors of performance (see Figure 7).
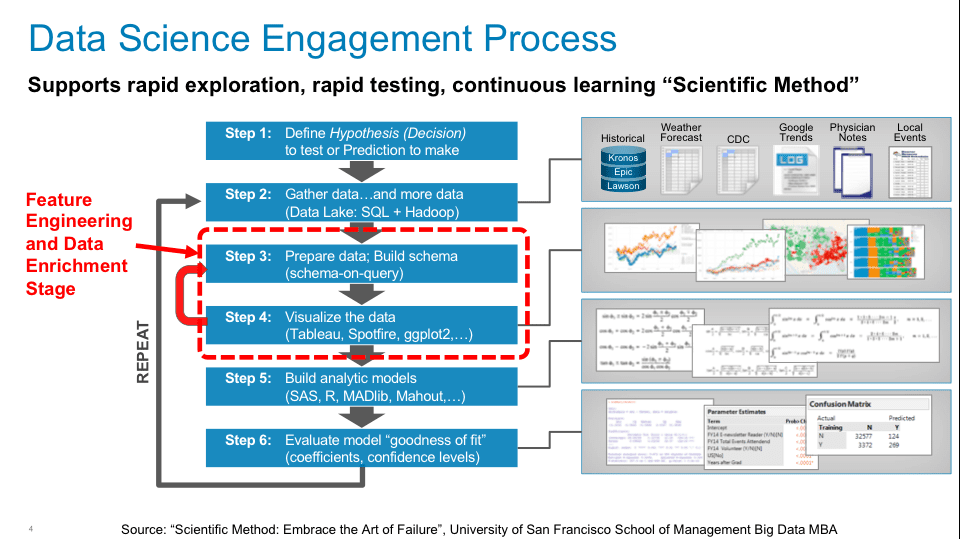
Figure 7: Data Science Engagement Process
Much of the initial Feature Engineering work is done by the Data Engineer who has gathered context on the business or operational use case through business stakeholder interviews. But as is shown in Figure 7, the Feature Engineering (and Data Enrichment) activity is an iterative process throughout the Data Science engagement between the Data Engineer and the Data Scientist in search of variables and metrics that might be better predictors of performance.
Summary
When I don’t really understand or appreciate a topic, I always find the best way to learn about it is to research and write about it. I also value hearing from folks who are subject matter experts and will point out anything I get wrong.
Hey, that’s typically for data – the Rodney Dangerfield of Corporate Assets!

Figure 8: LoadTVE: http://www.loadtve.biz/rodney-dangerfield-no-respect-album.html