
Humans and uncertainty
Since their early days, humans have had an important, often antagonistic relationship with uncertainty; we try to kill it everywhere we find it. Without an explanation for many natural phenomena, humans invented gods to explain them, and without certainty of the future, they consulted oracles.
It was precisely the oracle’s role to reduce uncertainty for their fellow humans, predicting their future and giving counsel according to their gods’ will, and even though their accuracy left much to be desired, they were believed, for any measure of certainty is better than none.
As society grew sophisticated, oracles were (not completely) displaced by empiric thought, which proved much more successful at prediction and counsel. Empiricism itself evolved into the collection of techniques we call the scientific method, which has proven to be much more effective at reducing uncertainty, and is modern society’s most trustworthy way of producing predictions. Statistics play a central role in most of science, providing the main instrument for measuring evidence and evaluating hypotheses. (Although the mainstream approach is deeply flawed in this regard).
Recently, advances in both statistical and computational theory and computing power have enabled the analysis of huge volumes of data, making predictions and recommendations possible without the need for a general theory, even leading some to proclaim that the scientific method is obsolete. Although I don’t agree, the power of this tools can’t be denied. This power, together with the complexity of both theory and practice that surrounds these tools, have turned those who wield it into the modern equivalent of oracles.
But tools have limitations, and the understanding of these is paramount for their users. In particular, I would like to talk about the limitations of two of the most popular tools for dealing with uncertainty: Frequentist Statistics and Supervised Learning.
Frequentist Statistics and its Limitations
Frequentism is the notion that frequencies approximate probability. Most of us are taught this notion in high school: toss a coin a bunch of times, compute the frequency of heads, compare with the theoretical probability of heads for a fair coin, and so on. Following this idea, probabilities are defined as the limit of the frequency when the “random experiment” is repeated. The more you can repeat it, the better approximation of a probability you will have. The collection of techniques derived from this idea is used in most of science, with frequent success.
However, a problem with the frequentist definition of probability is that it can’t assign a probability to unique events since they cannot be repeated. Yet in an informal way, people do assign such probabilities, so it would be desirable for a statistical theory to be able to deal with them. Frequentism gets around that by thinking of a “frame of reference”, that is, assuming that similar events can be thought to at least approximately come from the same “random experiment” (Thus, a frequentist may answer the election question by looking at past, similar elections). Theoretical rigor is abandoned in favor of applicability.
A similar problem arises when one wishes to think about the likelihood of an unknown quantity, or the truth of a statement about the past or present. For example, the likelihood that a hypothesis is true. Such a likelihood is impossible to measure for frequentist statistics, so when the question (central in science) is posed “How likely is it that this hypothesis is true, given these data?”, a very theoretically weak technique is used: the p-value.
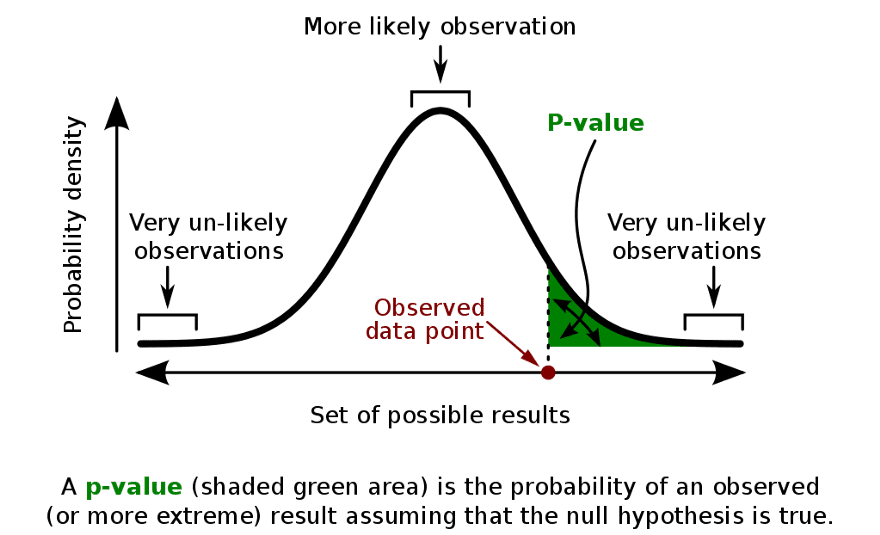
A graphical explanation of the p-value
The p-value can be (inaccurately) thought of as the answer to the question “How likely would be the data I collected, given that my hypothesis was wrong?”, the idea being that if it is really small, then maybe the hypothesis is true. Clearly, the two questions are not the same, yet most p-value users equate them. To explain the exact nature of the error here, an important theorem in probability is needed, which I will discuss soon.
Supervised Learning and its Limitations
A different approach can be taken, which assumes little to nothing about the nature of uncertainty and probability, and instead focuses its effort on producing the best prediction possible for a given task. This is the focus of supervised learning (SL), a type of machine learning (ML), which focuses on predicting a response variable y given a set of input variables (AKA features) x, observed on a dataset.
Mathematically, SL algorithms are trying to estimate the expected value of the response variable given the input variables, as a function of them, by adjusting parameters through observations of these variables. Many powerful methods have been devised to perform this task, and one must choose among a diversity of them depending on the nature of variables, dimensionality, and complexity of the phenomena which produces the data, among other things.
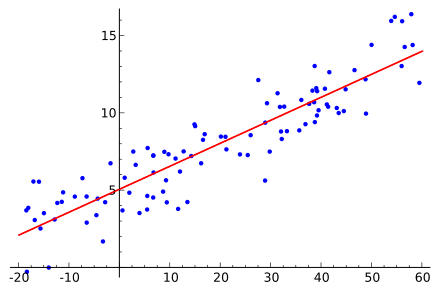
An example of an SL task, solved by Linear Regression
Because they are designed to do well on this problem, SL algorithms typically can’t deal with another type of questions. For example, one might wish to ask, given the input variables, how likely is it that the response rises above a given threshold. While this is a question that can be typically answered with a statistical model, not every ML model has a straightforward way to do it, and it is simply impossible for many.
Another problem that arises frequently when using some SL algorithms is the difficulty in interpreting their results. Take, for example, the multilayer perceptron, with many layers, an activation function per neuron (usually, per layer) and a lot of weights, it becomes quite difficult to explain what each parameter means, or pinpoint how a change in one of the inputs affects the response. Predictive power, in this case, comes at the cost of having to use the model as a sort of black box, its only task is to give out predictions, without context or interpretability.
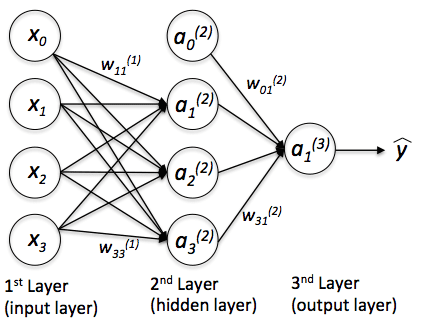
A multilayer perceptron
When we use predictive models as black boxes, without being aware of the assumptions they make about the data and the phenomenon, we risk falling into overcertainty. Since we know our predictions to be accurate (it is not uncommon for an ML algorithm to rise above 90% accuracy), but we don’t exactly know the inner workings of them, we tend to trust them completely, much as if they were oracles, and make decisions taking for granted their predictions.
A way to deal with overcertainty is to account for uncertainty, measuring and presenting it instead of reducing and hiding it, and a great framework to do this is known as Bayesian Statistics.
Bayesian Statistics
Bayesianism is rooted in the idea that probability is a measure of uncertainty and, as such, it is dependent on the information available to the individual making the measurement. As a measure, it can be applied to anything you can think of, including unique events, unknown quantities, or the truth about a statement.
The term refers to Thomas Bayes, an 18th-century reverend who proved a special case of the theorem that bears his name. This theorem provides a way to compute the “inverse probability”, that is, the probability of an event Agiven an event B when we know the probability of B given A.
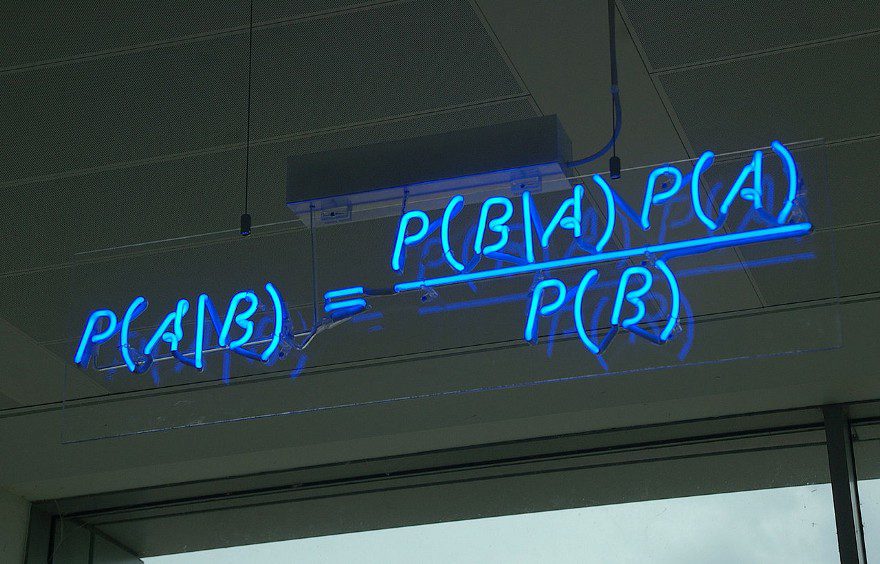
Bayes Theorem in a neon sign
For Bayesians, it is a way to make inference about parameters, given the model of the data and the prior distribution of the parameter. This prior distribution encodes the information possessed before any data is observed.
Through the use of this theorem and its definition of probability, Bayesian Statistics can combine information possessed about a phenomenon with observed data about it, and produce updated, more accurate information. And though the inference made in this way is subjective, the theory of Bayesian Statistics states that, as we collect more and more data, the subjective part (the prior information) becomes less and less relevant; the subjective approximates the objective.
Like in frequentism, simple Bayesian models have a straightforward interpretation, for example, the posterior distributions of linear coefficients measure the uncertainty
around the effect of an independent variable in the dependent.
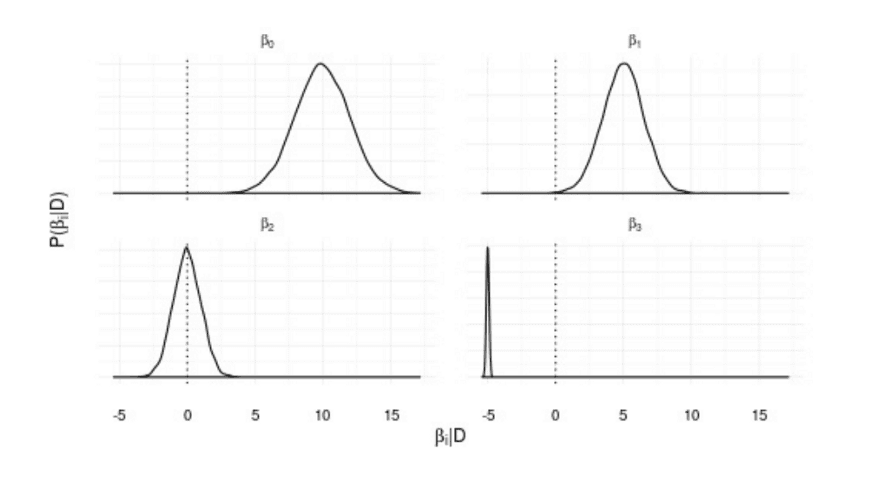
Posterior distributions for a Bayesian linear regression. The peak of the distribution represents the most likely value for the parameter, while the spread represents the uncertainty about it.
But unlike frequentists, bayesians can assign a probability to a hypothesis, and compute it directly using Bayes theorem. In this way, we can determine, with a strong basis in theory, the likelihood of a hypothesis given data.
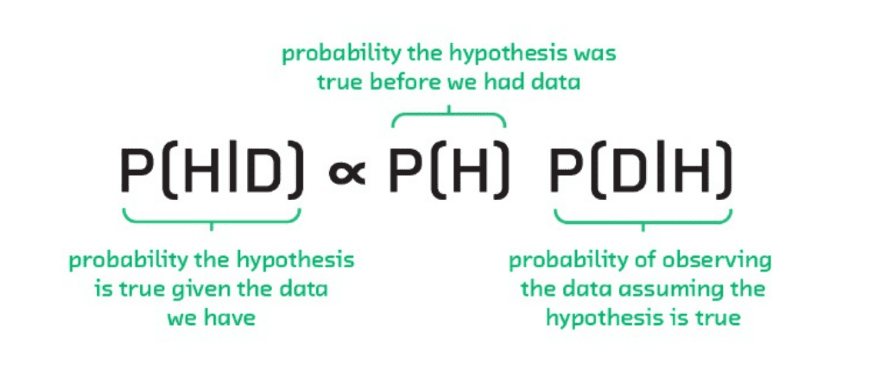
Bayes Theorem applied to hypothesis evaluation.
And, unlike supervised learning methods, statistics provide the full distribution of the response variable given the features, allowing us to ask any number of questions related to it. This conditional distribution also encodes the uncertainty about our predictions, allowing us, for example, to compute prediction intervals as opposed to single values for each input combination.
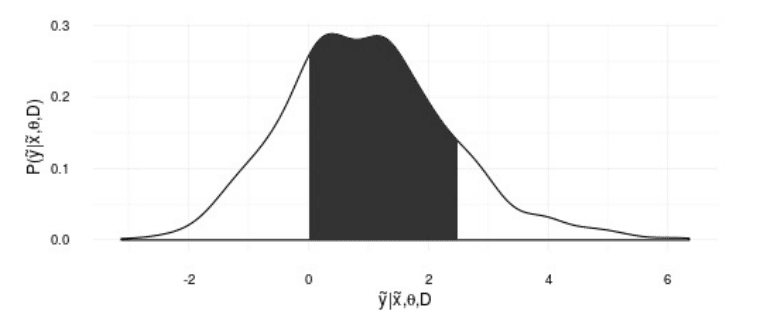
The predictive distribution of y given variables x and data D. The shadowed area represents the probability that y is between 0 and 2.5
Some Limitations
Of course, there is a reason mainstream science uses frequentist methods instead of bayesian ones, and it comes down to practicality; for the past centuries, the applicability of Bayesianism was limited by the hard, sometimes impossible, integrals that must be solved or approximated to make it work. One is needed to compute the “posterior” distribution, that is, the measure of uncertainty after observing data, and another for the predictive distribution, which will tell us what is the likely value of a “new” data point, possibly given some other variables.

The predictive distribution. This integral is often impossible to solve analytically
Fortunately, recent developments in Monte Carlo Markov Chains, have arisen as a way to simulate from these distributions without the need to explicitly compute the integrals. By simulating many observations from the posterior or predictive distributions, we can compute any probability that can be derived from them.
Even more advanced methods, such as Automatic Differentiation Variational Inference (ADVI) further reduce the time and tuning needed to arrive at the posterior distributions.
There are further philosophical questions and practical considerations that have prevented the mainstream use of these methods, although the latter have been somewhat lessened by recent developments in probabilistic programming.
Probabilistic Programming
Probabilistic programming is the name given to frameworks capable of fully specifying a Bayesian model and make inference with only a couple of lines.
The following snippets are taken from an example of a mean change detection model, taken from the excellent book by Cameron Davidson-Pilon, Bayesian Methods for Hackers, where you can find it in full.
Here is the model specification in PyMC3.
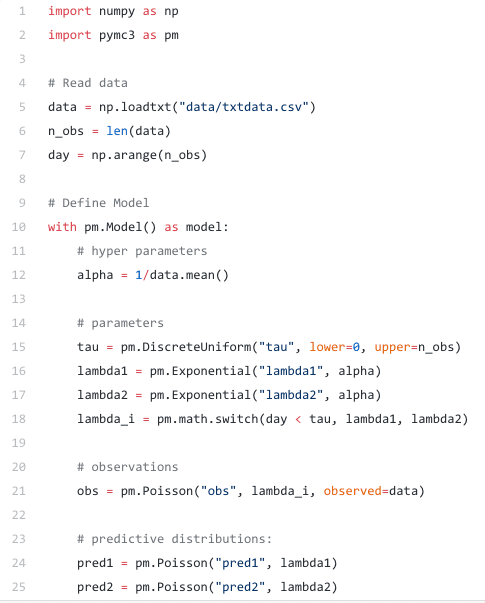
A mean change model using PyMC3
Making inference (i.e. solving those ugly integrals) can also be done in just a couple of lines
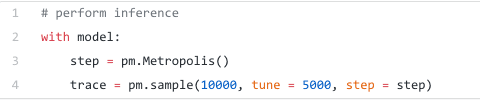
Inference using PyMC3, using the Metropolis MCMC algorithm
While PyMC3 is a great framework, there are many others if Python is not your cup of tea, such as Anglican for Clojure or the standalone Stan.
Love Uncertainty
In conclusion, Bayesian Statistics provide a framework for data analysis which can overcome many limitations prevalent in different techniques such as Supervised Learning and Frequentist Statistics.
In particular, they provide a way to deal with the problem of overcertainty, allowing us to ask questions about probability, and enabling the analyst to have a healthier relationship with uncertainty, by measuring and presenting it instead of blindly reducing it.
originally posted here