
This article is by Nikolay Laptev, Slawek Smyl, and Santhosh Shanmugam.
At Uber, event forecasting enables us to future-proof our services based on anticipated user demand. The goal is to accurately predict where, when, and how many ride requests Uber will receive at any given time.
Extreme events—peak travel times such as holidays, concerts, inclement weather, and sporting events—only heighten the importance of forecasting for operations planning. Calculating demand time series forecasting during extreme events is a critical component of anomaly detection, optimal resource allocation, and budgeting.
Although extreme event forecasting is a crucial piece of Uber operations, data sparsity makes accurate prediction challenging. Consider New Year’s Eve (NYE), one of the busiest dates for Uber. We only have a handful of NYEs to work with, and each instance might have a different cohort of users. In addition to historical data, extreme event prediction also depends on numerous external factors, including weather, population growth, and marketing changes such as driver incentives.
A combination of classical time series models, such as those found in the standard R forecast package, and machine learning methods are often used to forecast special events. These approaches, however, are neither flexible nor scalable enough for Uber.
In this article, we introduce an Uber forecasting model that combines historical data and external factors to more precisely predict extreme events, highlighting its new architecture and how it compares to our previous model.
Creating Uber’s new extreme event forecasting model:
Over time, we realized that in order to grow at scale we needed to upgrade our forecasting model to accurately predict extreme events across Uber markets.
We ultimately settled on conducting time series modeling based on the Long Short Term Memory (LSTM) architecture, a technique that features end-to-end modeling, ease of incorporating external variables, and automatic feature extraction abilities.4 By providing a large amount of data across numerous dimensions, an LSTM approach can model complex nonlinear feature interactions.
After choosing our architecture, we assessed the data backlog we required to train our model, demonstrated below:
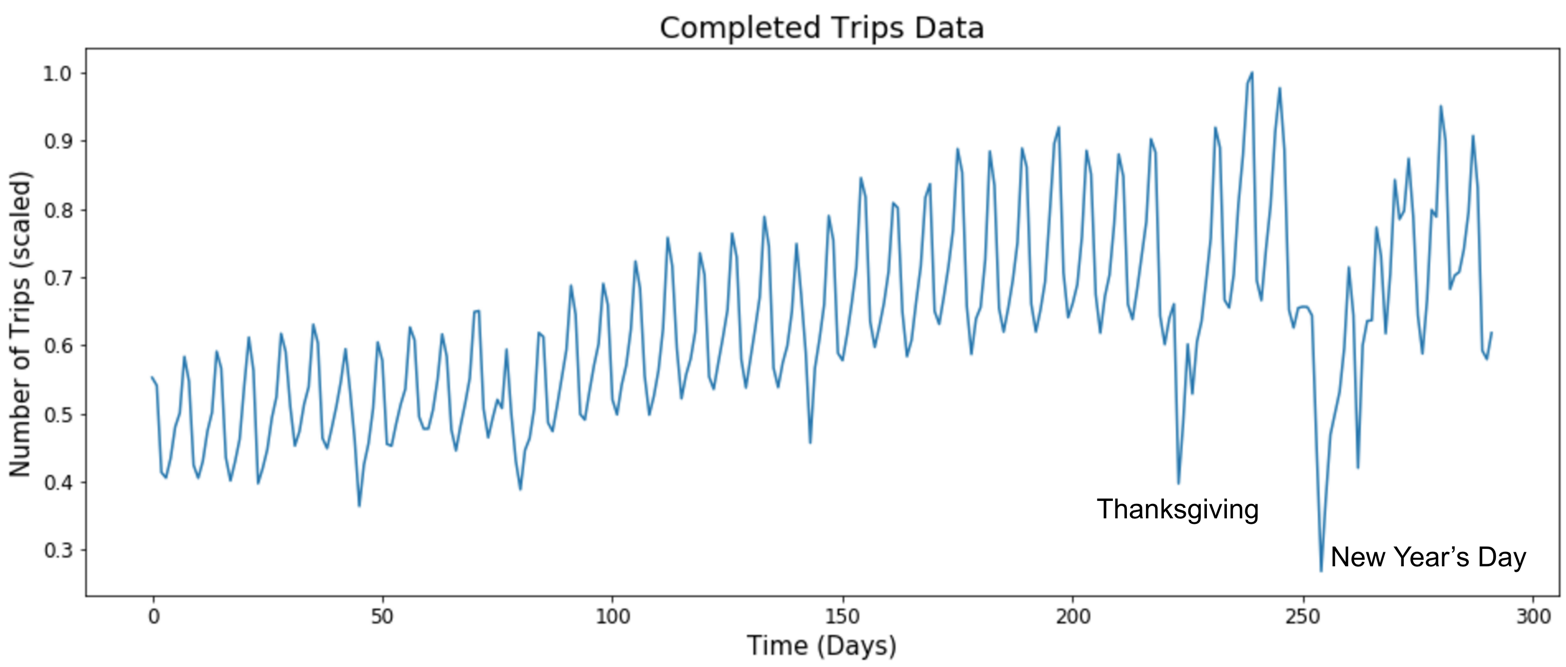
Figure 1: The scaled number of trips taken over time in a city is part of the historical data backlog used to train our model. Notice a dip during NYE and then a sharp spike, indicating people taking rides home with Uber on New Year’s Day.
Forecasting for extreme events can be difficult because of their infrequency. To overcome this data deficiency, we decided to train a single, flexible neural network to model data from many cities at once, which greatly improved our accuracy.
Building a new architecture with neural networks:
Our goal was to design a generic, end-to-end time series forecasting model that is scalable, accurate, and applicable to heterogeneous time series. To achieve this, we used thousands of time series to train a multi-module neural network.
We measured and tracked raw external data to build this neural network, demonstrated below:
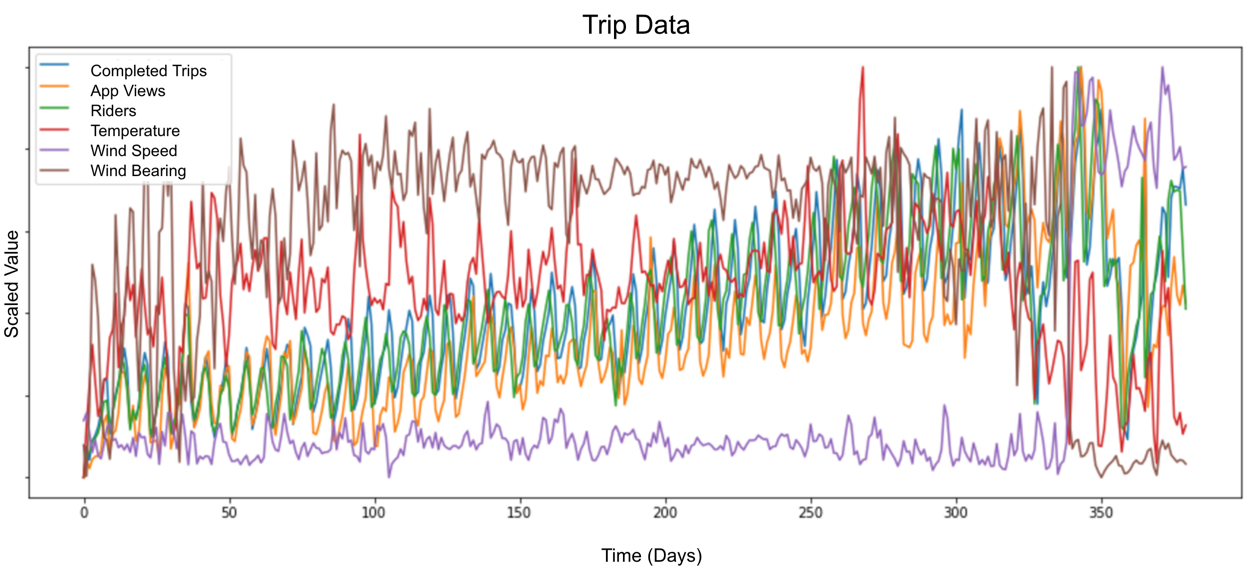
Figure 2: Our model was trained using a combination of exogenous variables, including weather (e.g., precipitation, wind speed, and temperature forecasts) and city-level information (e.g., trips in progress at any given time within a specific geographic area, registered Uber users, and local holidays or events).
This raw data was used in our training model to conduct simple preprocessing, including log transformation, scaling, and data detrending.
To read the full original article click here. For more neural network related articles on DSC click here.
DSC Resources
- Services: Hire a Data Scientist | Search DSC | Classifieds | Find a Job
- Contributors: Post a Blog | Ask a Question
- Follow us: @DataScienceCtrl | @AnalyticBridge
Popular Articles