In the previous example we used clustering to see if an apparent pattern exists within Brexit tweets. We found out that we have three distinct patterns, the leave, the referendum, and Brexit. This in itself helps us think that we may even create a classifier that can identify if the tweet writer is pro or agains an issue automatically, with no human intervention.
Let’s get back to the issues related to clustering. To use the clustering algorithm we had to map 2 tweets at the time to a binary vector. In the initial clustering approach we did not remove low frequency words, in spite of practitioners recommendation. In this blog, we will see if a different mapping of the tweets, different dissimilarity or similarity distances, and if removing low frequency words change the outcome of clustering function. While this work is just a simple exercise, it does help us define issues in our more pressing problems.
Never Assume, but Try
From the text mining literature, it appears that practitioners tend to utilize Cosine Distance to compare 2 documents. They have used it with great success. From our previous blog, we also used Cosine Distance and we also found it extremely good and helping us, and our clustering method, get an insight in the UK Exit Referendum. In here, we decided to change our initial conditions and see if we get different outcomes,i.e. different number of clusters or different clusters size. We decided to try 4 others distances: Jaccard, Matching, Rogers Tanimoto and Euclidean. Except of Euclidean distance, all the other three distances work with boolean vectors.
| Distance |
# Clusters |
Clusters Size |
| Jaccard |
3 |
381, 667, 613 |
| Matching |
3 |
980, 275, 406 |
| Rogers |
3 |
980, 275, 406 |
| Euclidean |
3 |
980, 275, 406 |
| Cosine |
1 |
1661 |
Jaccard Dissimilarity: (N10 + N01)/ (N11+N10+N01) where Nij is the correspond pairs of elements in tweet1 and tweet2, and N is count of numbers of pairs.
Matching Dissimilarity: (N01+N10)/number of words in tweet1 Here we assume that the tweets have the same number of words.
Rogers Tanimoto Dissimilarity: 2 (N10 + N01)/(N11+2(N10+N01)+N00)
Euclidean Distance: Norm[Tweet1-Tweet2] or the square root of the sum of the square differences between values in Tweet1 and Tweet2.
Global Normalized Tweets:
Dissimilarity Distances:
We normalized our tweets, and put each in a matrix of 1661 (number of tweets) rows, and 3239 (number of distinct words in tweets) columns. Jaccard dissimilarty, Matching Distance, Rogers Tanimoto dissimilarity, Cosine Distance, and Euclidean Distance. We printed the results in the following table:
| Distance |
# Clusters |
Clusters Size |
| Jaccard |
3 |
381, 667, 613 |
| Matching |
3 |
980, 275, 406 |
| Rogers |
3 |
980, 275, 406 |
| Euclidean |
3 |
980, 275, 406 |
| Cosine |
1 |
1661 |
From this table, you can see that except for Cosine Distance, all the other distances resulted in the same number of clusters. Furthermore, Rogers, Euclidean, and Matching all had exactly the same number of clusters and the clusters had the same size. In Comparison of Similarity Coefficients Used for Cluster Analysis Based on RAPB Markers in Wild Olive M. Sesli and E. D. Yegenoglu confirms that Rogers and Matching results tend to be highly correlated, which explains the similar results between Matching and Rogers. They also found very little correlation between Jaccard and Rogers, which also explains the different clustering results.
Short Insight Into the Clusters Content:
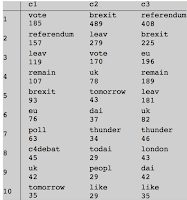
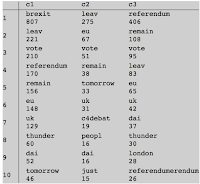
In the clusters created thank to Jaccard, cluster 2 doesn’t have remain or referendum as a top frequency word. Cluster 3 has mostly the mention of referendum and Brexit with leave and remain frequencies similar in values. In the clusters created by Rogers, Matching, or Euclidean distances the word referendum is the most frequent in cluster 3, but not in the top 10 in cluster 2. Furthermore, in clusters 3 and 2, Brexit is not in the top 10 most frequent word, while leave is among the top 10 in all three clusters; cluster 2 in Rogers et.al has the top frequency word leave. Hence, while Jaccard distance resulted in the production of 3 clusters their content differs from the clusters created by Matching, Rogers, and Euclidean.
Figure 1. 10 Most Frequent Words for 3 Clusters using Jaccard Figure 2. 10 Most Frequent Words for Matching/Rogers/Euclidean
Remove Low Frequency Words
When we remove low frequency words, words that appear only once in all the tweets, and normalize the tweets, we find that both Euclidean and Cosine return only one cluster. They fail to distinguish between tweets. The use of Jaccard returns only 2 clusters, while Match and Rogers return 3 clusters of size 619, 667, and 360.
| Distance |
# Clusters |
Clusters Size |
| Jaccard |
2 |
962, 684 |
| Matching |
3 |
619,667, 360 |
| Rogers |
3 |
619,667, 360 |
| Euclidean |
1 |
1646 |
| Cosine |
1 |
1646 |
Local Normalized Tweets With Removed Low Frequency Words:
In here, we did only 2 tweets normalization (see previous blog). As you notice, Jaccard and Matching had the same results; and Rogers, Euclide, and Cosine had the same results. It is interesting that Rogers performance has been consistent irrespective of when normalization has been performed. However, the performance with the other distances has been dependent on the normalization of the tweets.
| Distance |
# Clusters |
Clusters Size |
| Jaccard |
2 |
1241, 405 |
| Matching |
2 |
1241, 405 |
| Rogers |
3 |
619, 667, 360 |
| Euclide |
3 |
619, 667, 360 |
| Cosine |
3 |
619, 667, 360 |
By the way, we also tried Ochiai Distance which is the binary version of Cosine and, as expected, the results matched Cosine Distance.
Short Insight into the Clusters Content:
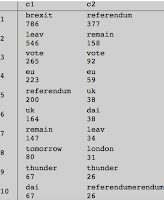
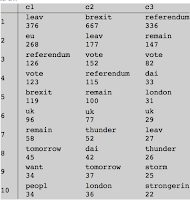
In the Jaccard and Matching where 2 clusters were found, the first cluster had Brexit and leave as the most frequent words, while in the second one the most frequent word was referendum. Still, leave was in the top 10 most frequent words in the referendum cluster. On the other hand, for the 3 clusters formation, just like the findings in the previous blog, the first cluster had leave and EU as the 2 most frequent words, but it doesn’t have the word eu; the second cluster had Brexit butleave was among the top 5 most frequent words; finally, the third cluster had Referendum and remain as the top 2 most frequent words. What is interesting in Figure 4, and Figure 2 is that they match in the top 3 values in 2 clusters: cluster 3 from both approach, and cluster 2 from Figure 4 and cluster 1 from Figure 2. One also notices that the top 3 most frequent words in both clusters in Figure 3 match the top most frequent words in cluster 2 and cluster 3.
Figure 3. 10 Most Frequent Words for 2 Clusters Figure 4. 10 Most Frequent Words for 3 Clusters
Conclusion:
The choice of distance, and whether to locally or globally normalize tweets has a direct effect on the outcome of a clustering outcome. While other practitioners have shown a high correlation between Matching distance and Rogers and Tanimoto dissimilarity distance, our little experiment shows different outcome when we perform localized normalization. We were surprised to see that Cosine distance performed the worse during globalized normalization.
Even the content of the clusters dependent on not only normalization (global or local) and if we removed low frequency words. Still, by removing the low frequency word, the clusters gave better insight. Even in the 2 clusters formation, The clusters brought to our attention the fact that the issue was debated into 2 fronts:
leave and
remain. Furthermore, they were all talking about referendum or Brexit. The three clusters formation went further by creating a cluster where
leave is the most talked about. In short, choose your dissimilarity distance carefully, remove low frequency words, and perform local normalization.
Note: I’m still looking for a better word to normalization in this context.


